Knowing PySpark and Kafka: A 100 Million Events Use-Case

Knowing Spark and Kafka: A 100 Million Events Use-Case
A typical day in the eCommerce market of streaming 10,000 events per minute and choosing the right tools to handle it
This article will help you re-create a scenario where you have a huge volume of data flowing in and you not only have to store this data but perform some real-time analytics as well!
This is just one of the examples of System Design where you’ve got to develop a highly available and scalable data pipeline. While there could be ’n’ number of other factors to be considered for a use-case like that of e-commerce, for the sake of this article we’ll break this into 3 major sections:
- Ingestion
- Processing
- Output
That, in a nutshell, is bird’s eye view of almost every system design and also where things could go awry.
INGESTION LAYER
Before jumping right into our tools, let’s take a step back and see what kind of use-case or problem are we trying to address here. To know our Input or Ingestion layer, knowing our Output layer becomes a priority. Generally, there are two ways by which you may present your findings:
- Batch Processing: If your analysis is only one-time or maybe it’s just a daily report update or just a random presentation within your team, you could opt to ingest data in batches. This could mean taking out a small data dump from your DB and doing some analysis with it.
- Real-Time Processing: Also known as Streaming Data is the kind of approach you’d follow when analysis of new data is critical. Mostly seen in B2C scenarios, where you perform actions on the fly.
The good thing about batch is it takes away the overhead of building real-time pipelines and you’ll never be working on your complete data set. Although, this does not apply in B2C environments, especially e-commerce where you have to recommend new products, track user-journey or design real-time dashboards.
Now that we know our Output Layer is going to be real-time, we’ll choose our Ingestion Tools accordingly. Surely, there are tons of tools out there for you to ingest data from but going by popularity, community strength and implementation across various use-cases, we’ll pick up Kafka and Spark Streaming.
Here again, it is important to know your business requirements in order to decide on several tools that perform the same job. In a scenario like e-comm, we already know we want in terms of real-time output but what is the number we’re talking here?
1–2 seconds is quite real-time! Yes, it is but not really for an e-comm website where your users won’t wait for more than a second to perform the next click. This brings us to the concept of latency. This is the metric we’d use to choose our ingestion tool. There are tons of differences between the two tools, but Kafka is one such that provides milliseconds of latency!
PROCESSING LAYER
In our use-case, we’ll go over the processing mechanisms of Spark and Kafka separately. We’ll see how spark makes is possible to process data that the underlying hardware isn’t supposed to practically hold. On the other hand, we’ll see how easy it is to consume data using Kafka and how it makes it possible at this scale of millions.
I’ll be using the following dataset from Kaggle which has over 100 million rows
https://www.kaggle.com/mkechinov/ecommerce-behavior-data-from-multi-category-store
Unless you own a very high-end machine, it is not possible to load the entire dataset into your local machine’s memory, not even by splitting it into batches unless of course you perform processing on every incoming batch but then that is why we use something like Spark.
THE INFRASTRUCTURE
Setting up spark has its complexity, hence, to speed things up we’ll launch a Spark Cluster on Databricks, allowing you to quickly launch clusters with data support from AWS S3 which is where our data resides.
Spark follows the typical Master-Slave architecture, which to summarize means that the Master Server is responsible for all the job scheduling stuff plus a few more things and on the other hand, the Slave Server is responsible for performing the actual operations or keeping data in-memory.
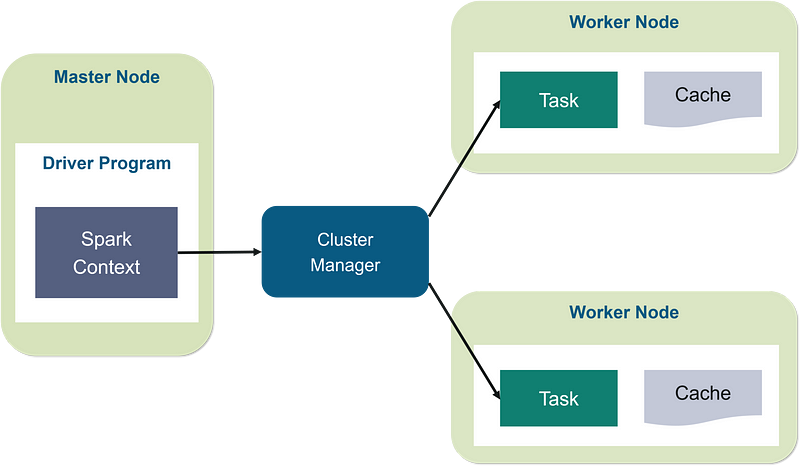
We’ll go into more details for Spark as we implement it on our data. For now, I’ve spun up a 1 Worker Node + 1 Master Node Cluster on databricks, giving me a total of 2 cores and 8 GB Memory, although complete configuration would be 4 cores and 16 GB of memory.
It’s 2 and 8 since all of our spark operations would take place on worker nodes only and we have only 1 worker node. The number of cores i.e. 2 will play a key role here as this where all the parallelization stuff would happen.
READING 14 GB DATA ON 8 GB MEMORY
It is impractical to store data in memory that is greater than the memory itself, hence, what spark does is, it will load data into memory only when you’d want to do some operation on it. As an example, the following line would read our dataset parallelly i.e. utilize 2 cores to read our data.
ecomm_df = sparkSession.read.csv("/mnt/%s/ecomm.csv" % MOUNT_NAME, header=TrueOur 14 GB file is going to be ingested in approximately 112 small chunks and since we have 2 cores, the ingestion will be 2 chunks at a time of 128 MB each
Although, spark won’t start reading in the file just as you submit this command as there’s a whole another concept of lazy evaluation which makes it not read it the traditional pythonic way! But we could still check the number of partition/chunks for this file by quickly converting into an RDDecomm_df.rdd.getNumPartitions()
OUTPUT: 110 #Number of partitions
This is quite close to what we calculated. Check this out to know how I calculated 112 partitions from the file size of 14 GB.
Now, without getting too technical let’s get a quick glimpse of our data
row(event_time='2019-11-01 00:00:00 UTC', event_type='view', product_id='1003461', category_id='2053013555631882655', category_code='electronics.smartphone', brand='xiaomi', price='489.07', user_id='520088904', user_session='4d3b30da-a5e4-49df-b1a8-ba5943f1dd33')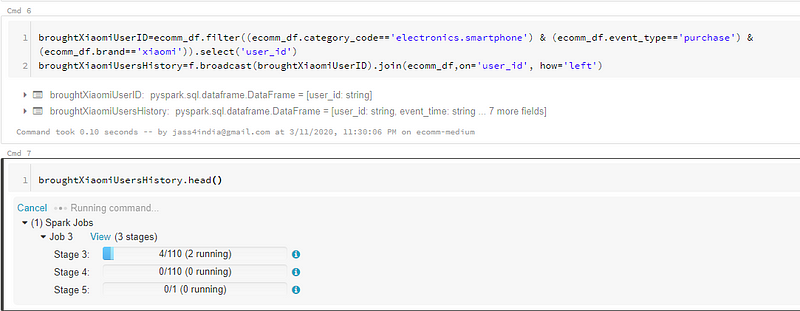

Now that you know the capabilities of spark, it qualifies to be a very scalable approach to train/analyze almost any size of data on a limited set of resources
SIMULATING REAL-TIME INGESTION OF DATA
We’ve discussed quite a few pointers about Kafka previously and so without getting in too much depth, let’s see how our Kafka pipeline of ingesting this kind of data in real-scenario would look like!
When we talk about numbers like 100 million events at any given time, scalability becomes a priority and so does the understanding of partitions and consumer groups. The 2 components can make or break our system at this scale of ingestion. Have a look at this architecture to get an overview of the Kafka system
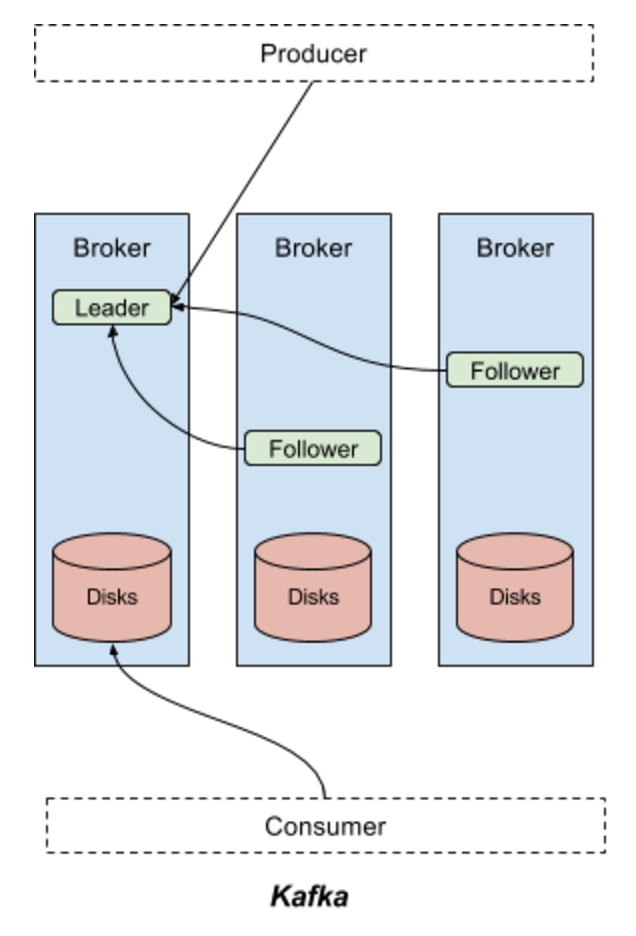
A real-world replica of this model would be your mail/letterbox.
- Post-Man: This guy is the producer, whose job is just to pick data and drop it in your mailbox
- Mail/Letter Box: This is your broker, the letters will keep piling up if no one comes to collect it.
- Your Address: This is your topic, how does the post-man know where to send this data?
- You: You are the consumer, it’s your responsibility to collect this data and process it further
This is a very simple explanation of the Kafka Data-Flow mechanism and enough to understand the article further, while the concept of partitions and consumer groups will help you understand the code snippets as well
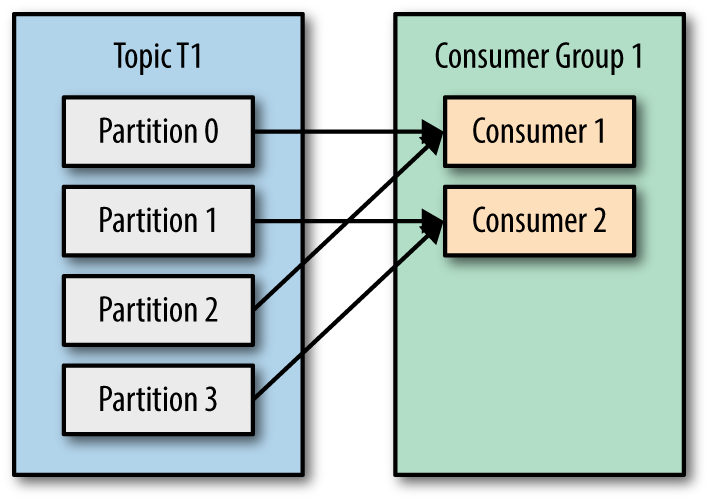
At this scale, you want to parallelize consuming of your data. To do this, one could break the incoming data into different partitions and when this happens, we can set up consumer groups, which means multiple consumers wanting to read from the same source.
Referring to the architecture above, the 2 consumers are reading from the same source, thus, reading more data at the same time but not reading the same data. If Consumer 1 has read row 1 and 2, Consumer 2 would never see this data as this segregation happened at the partition level already!
Here’s a small implementation I did on ingesting this kind of data at scale using partitions and consumer groups
# 4 Partitions Made
# Topic Name : ecomm_test
Send data to the ecomm_test topic
producer.send(topic='ecomm_test', value=line)
# Start 2 consumers and assign it to the group "ecommGroup"
consumer = KafkaConsumer('ecomm_test', group_id='ecommGroup')
consumer = KafkaConsumer('ecomm_test', group_id='ecommGroup')
# Output of how consumer 1 reads data, only reading from 2 partitions i.e. 0 & 1
# Output of how consumer 2 reads data, only reading from 2 partitions i.e. 2 & 3
ConsumerRecord(topic=u'ecomm_test', partition=3, value='2019-11-01 00:00:05 UTC,view,4600658,2053013563944993659,appliances.kitchen.dishwasher,samsung,411.83,526595547,aab33a9a-29c3-4d50-84c1-8a2bc9256104\n')ConsumerRecord(topic=u'ecomm_test', partition=2, value='2019-11-01 00:00:01 UTC,view,1306421,2053013558920217191,computers.notebook,hp,514.56,514028527,df8184cc-3694-4549-8c8c-6b5171877376\n')A KISS PRODUCTION ARCHITECTURE: THE OUTPUT
We just need to make sure we align with the following concepts well:
- KISS: Keep It Simple Stupid: Keep the architecture as simple as possible
- Microservices: Decouple components to avoid a chain of failures
- CAP Theorem: Consistency, Availability, Partition-Tolerance. Choose 2 most important to you
Finally, we walk through the final architecture that could be implemented in a production system, although they’re a lot of other components involved as well like availability zones, storage systems, fail-over plans but this is just an overview of our final processing layer in production
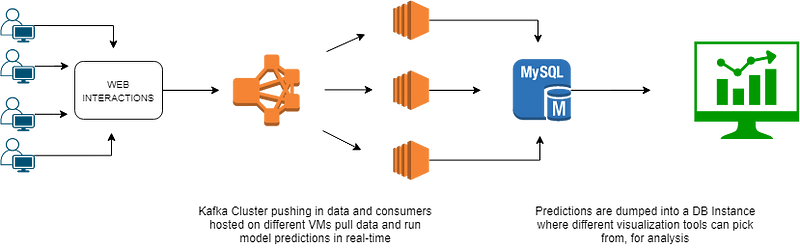
As you can see, the diagram is self-explanatory; there is no one correct architecture/system-design for all use-cases, you just build what works given your resources.
Feel free to reach out or post your questions/feedback down here
Cheers!

Comments ()